This post provides highlights from Hilsoft’s recent business intelligence dashboard for a distribution company.
Here are the dashboard templates:
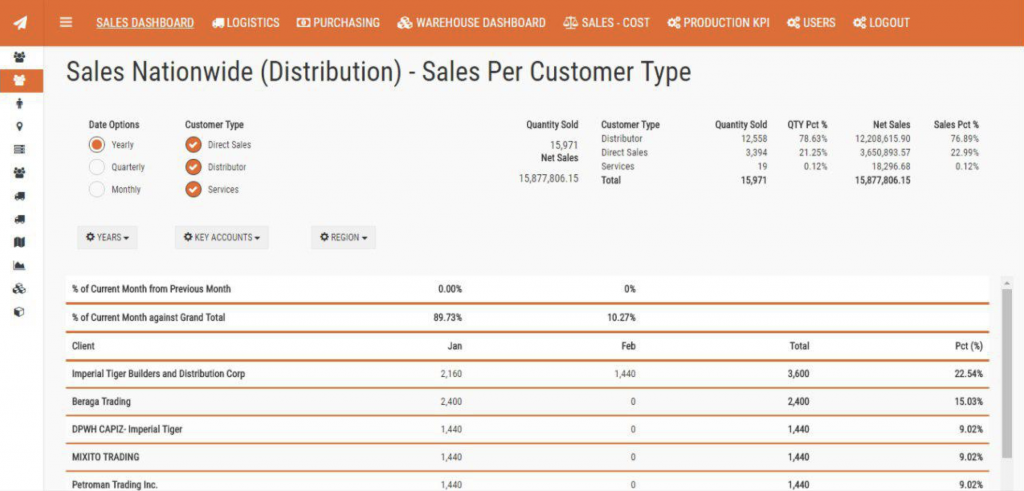
Nationwide Sales per Customer Type
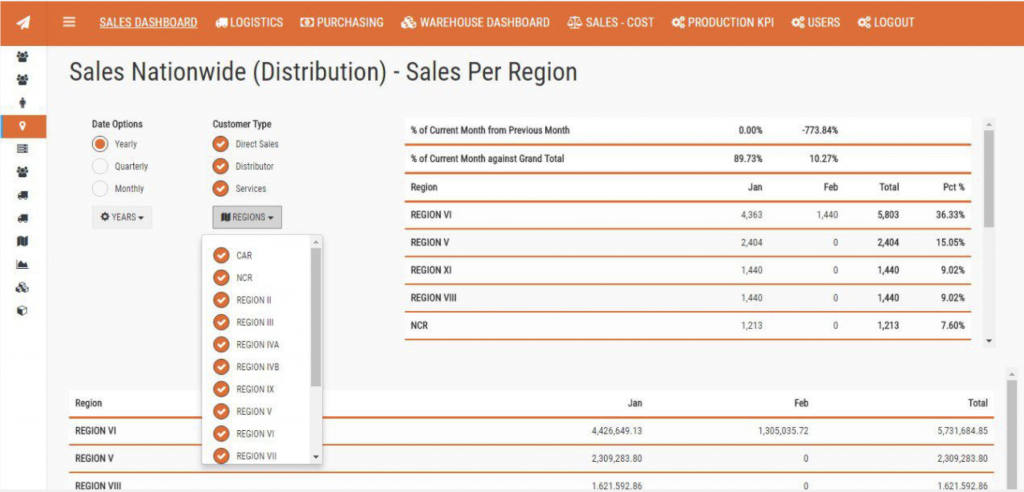
Nationwide Sales Per Region
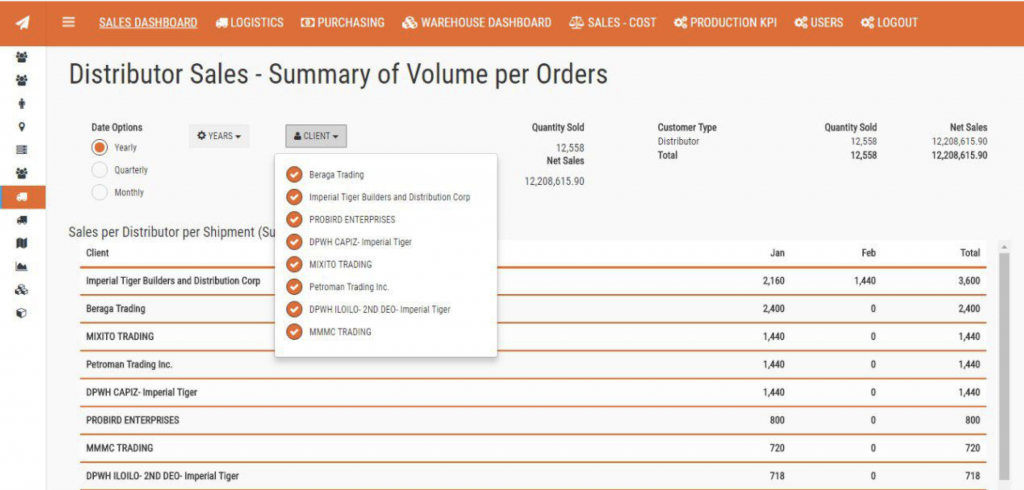
Volume Sales Per Distributor
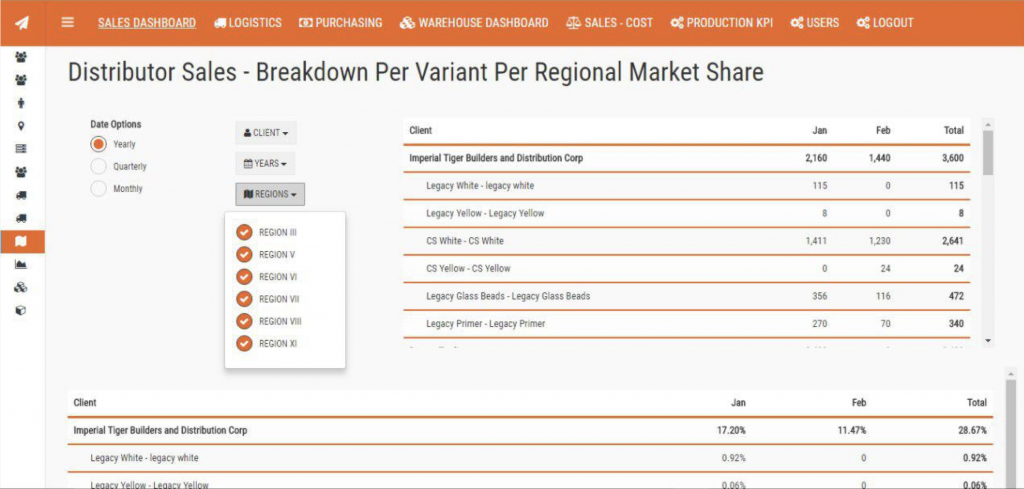
Product Sales per Region
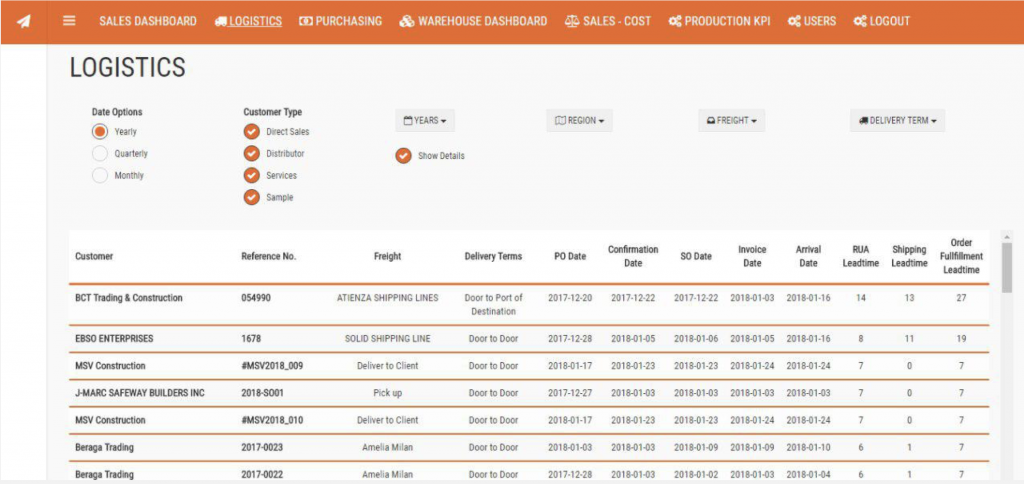
Logistics
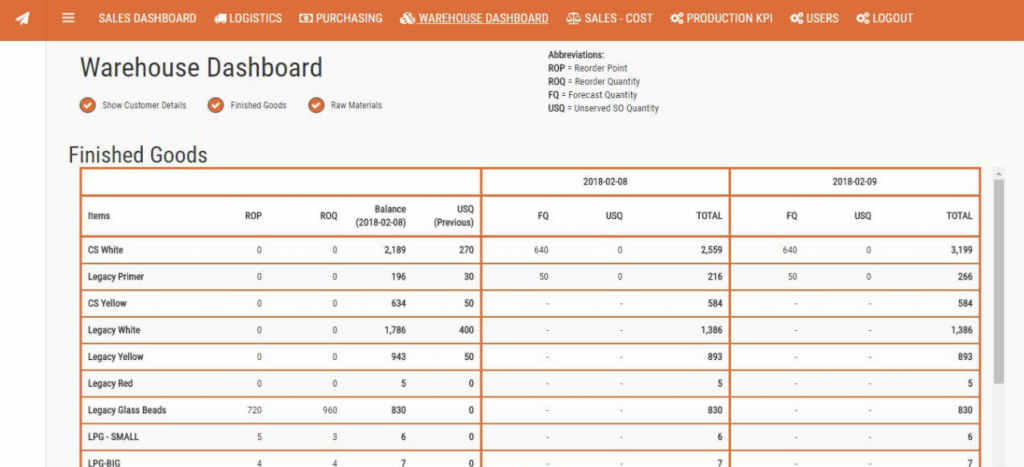
Warehouse Dashboard
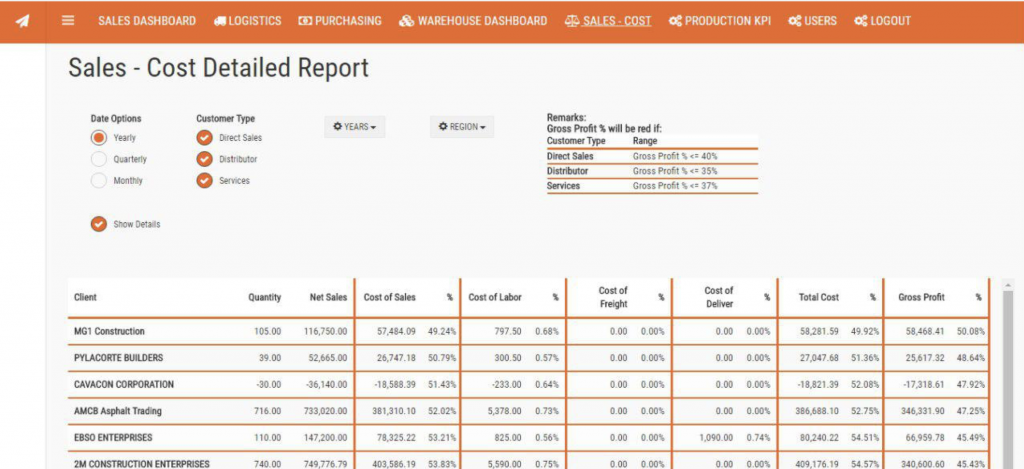
Profitability
These dashboards are accessible on the web and it is mobile responsive. Should you wish to have your own dashboards or customize these, then feel free to contact us here.